代码拉取完成,页面将自动刷新
![]() English | 简体中文
English | 简体中文
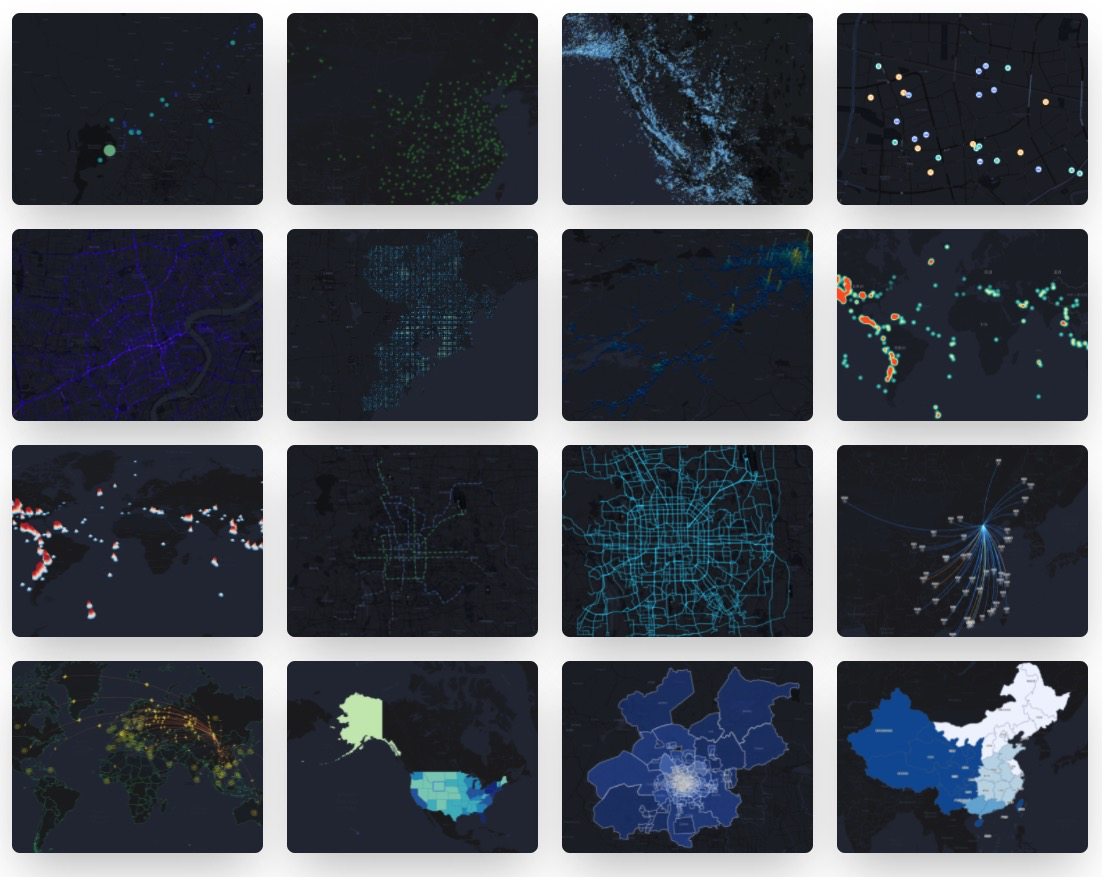
🌍 PyL7Plot 是 @AntV/L7Plot 在 Python3 上的封装。L7Plot 是基于 L7 的地理空间可视化图表库。

![]()
$ pip install pyl7plot
from pyl7plot import Plot

dot = Plot("Dot")

dot.set_options({
  "map": {
    "type": "mapbox",
    "style": "light",
    "center": [103.447303, 31.753574],
    "zoom": 7,
  },
  "autoFit": True,
  "source": {
    "data": [
       { "lng": 103.715, "lat": 31.211, "depth": 10, "mag": 5.8, "title": "M 5.8 - eastern Sichuan, China" },
       { "lng": 104.682, "lat": 31.342, "depth": 10, "mag": 5.7, "title": "M 5.7 - eastern Sichuan, China" },
       # ...
    ],
    "parser": { "type": "json", "x": "lng", "y": "lat" },
  },
  "color": {
    "field": "mag",
    "value": ["#82cf9c", "#10b3b0", "#2033ab"],
    "scale": { "type": "quantize" },
  },
  "size": {
    "field": "mag",
  },
  "state": { "active": True },
  "scale": { "position": "bottomright" },
  "legend": { "position": "bottomleft" },
  "tooltip": {
    "items": ["title", "mag", "depth"],
  },
})

# 渲染成 html 文件
dot.render("dot.html")

# 或者渲染成 html 字符串
# dot.render_html()

from pyl7plot import Plot, JS

dot = Plot("Dot")

dot.set_options({
  "map": {
    "type": "mapbox",
    "style": "light",
    "center": [103.447303, 31.753574],
    "zoom": 7,
  },
  "autoFit": True,
  "height": 400, # 设置在 jupyter 预览的高度
  "source": {
    "data": [
       { "lng": 103.715, "lat": 31.211, "depth": 10, "mag": 5.8, "title": "M 5.8 - eastern Sichuan, China" },
       { "lng": 104.682, "lat": 31.342, "depth": 10, "mag": 5.7, "title": "M 5.7 - eastern Sichuan, China" },
       # ...
    ],
    "parser": { "type": "json", "x": "lng", "y": "lat" },
  },
  "color": {
    "field": "mag",
    "value": ["#82cf9c", "#10b3b0", "#2033ab"],
    "scale": { "type": "quantize" },
  },
  "size": {
    "field": "mag",
    # 使用 JS 方法,可以创建一个 JavaScript 的代码片段去处理各种回调方法属性
    "value": JS('''function({ mag }) {
        return (mag - 4.3) * 10;
      }''')
  },
  "state": { "active": True },
  "scale": { "position": "bottomright" },
  "legend": { "position": "bottomleft" },
  "tooltip": {
    "items": ["title", "mag", "depth"],
  },
})

# 渲染到 notebook
dot.render_notebook()

# 或者渲染到 jupyter lab
# dot.render_jupyter_lab()
更多 PyL7plot 在线 Jupyter Lab 示例。
Plot(plot_type: str): 获取 Plot 对应的类实例。
plot.set_options(options: object): 给图表实例设置一个 L7Plot 图形的配置,文档可以直接参考 L7Plot 官网,未进行任何二次数据结构包装。
plot.render(path, env, **kwargs): 渲染出一个 HTML 文件,同时可以传入文件的路径,以及 jinja2 env 和 kwargs 参数。
plot.render_notebook(env, **kwargs): 将图表渲染到 jupyter 的预览。
plot.render_jupyter_lab(env, **kwargs): 将图表渲染到 jupyter lab 的预览。
plot.render_html(env, **kwargs): 渲染出 HTML 字符串,同时可以传入 jinja2 env 和 kwargs 参数。
此处可能存在不合适展示的内容,页面不予展示。您可通过相关编辑功能自查并修改。
如您确认内容无涉及 不当用语 / 纯广告导流 / 暴力 / 低俗色情 / 侵权 / 盗版 / 虚假 / 无价值内容或违法国家有关法律法规的内容,可点击提交进行申诉,我们将尽快为您处理。